
Calgary Housing Market Update: August 2026
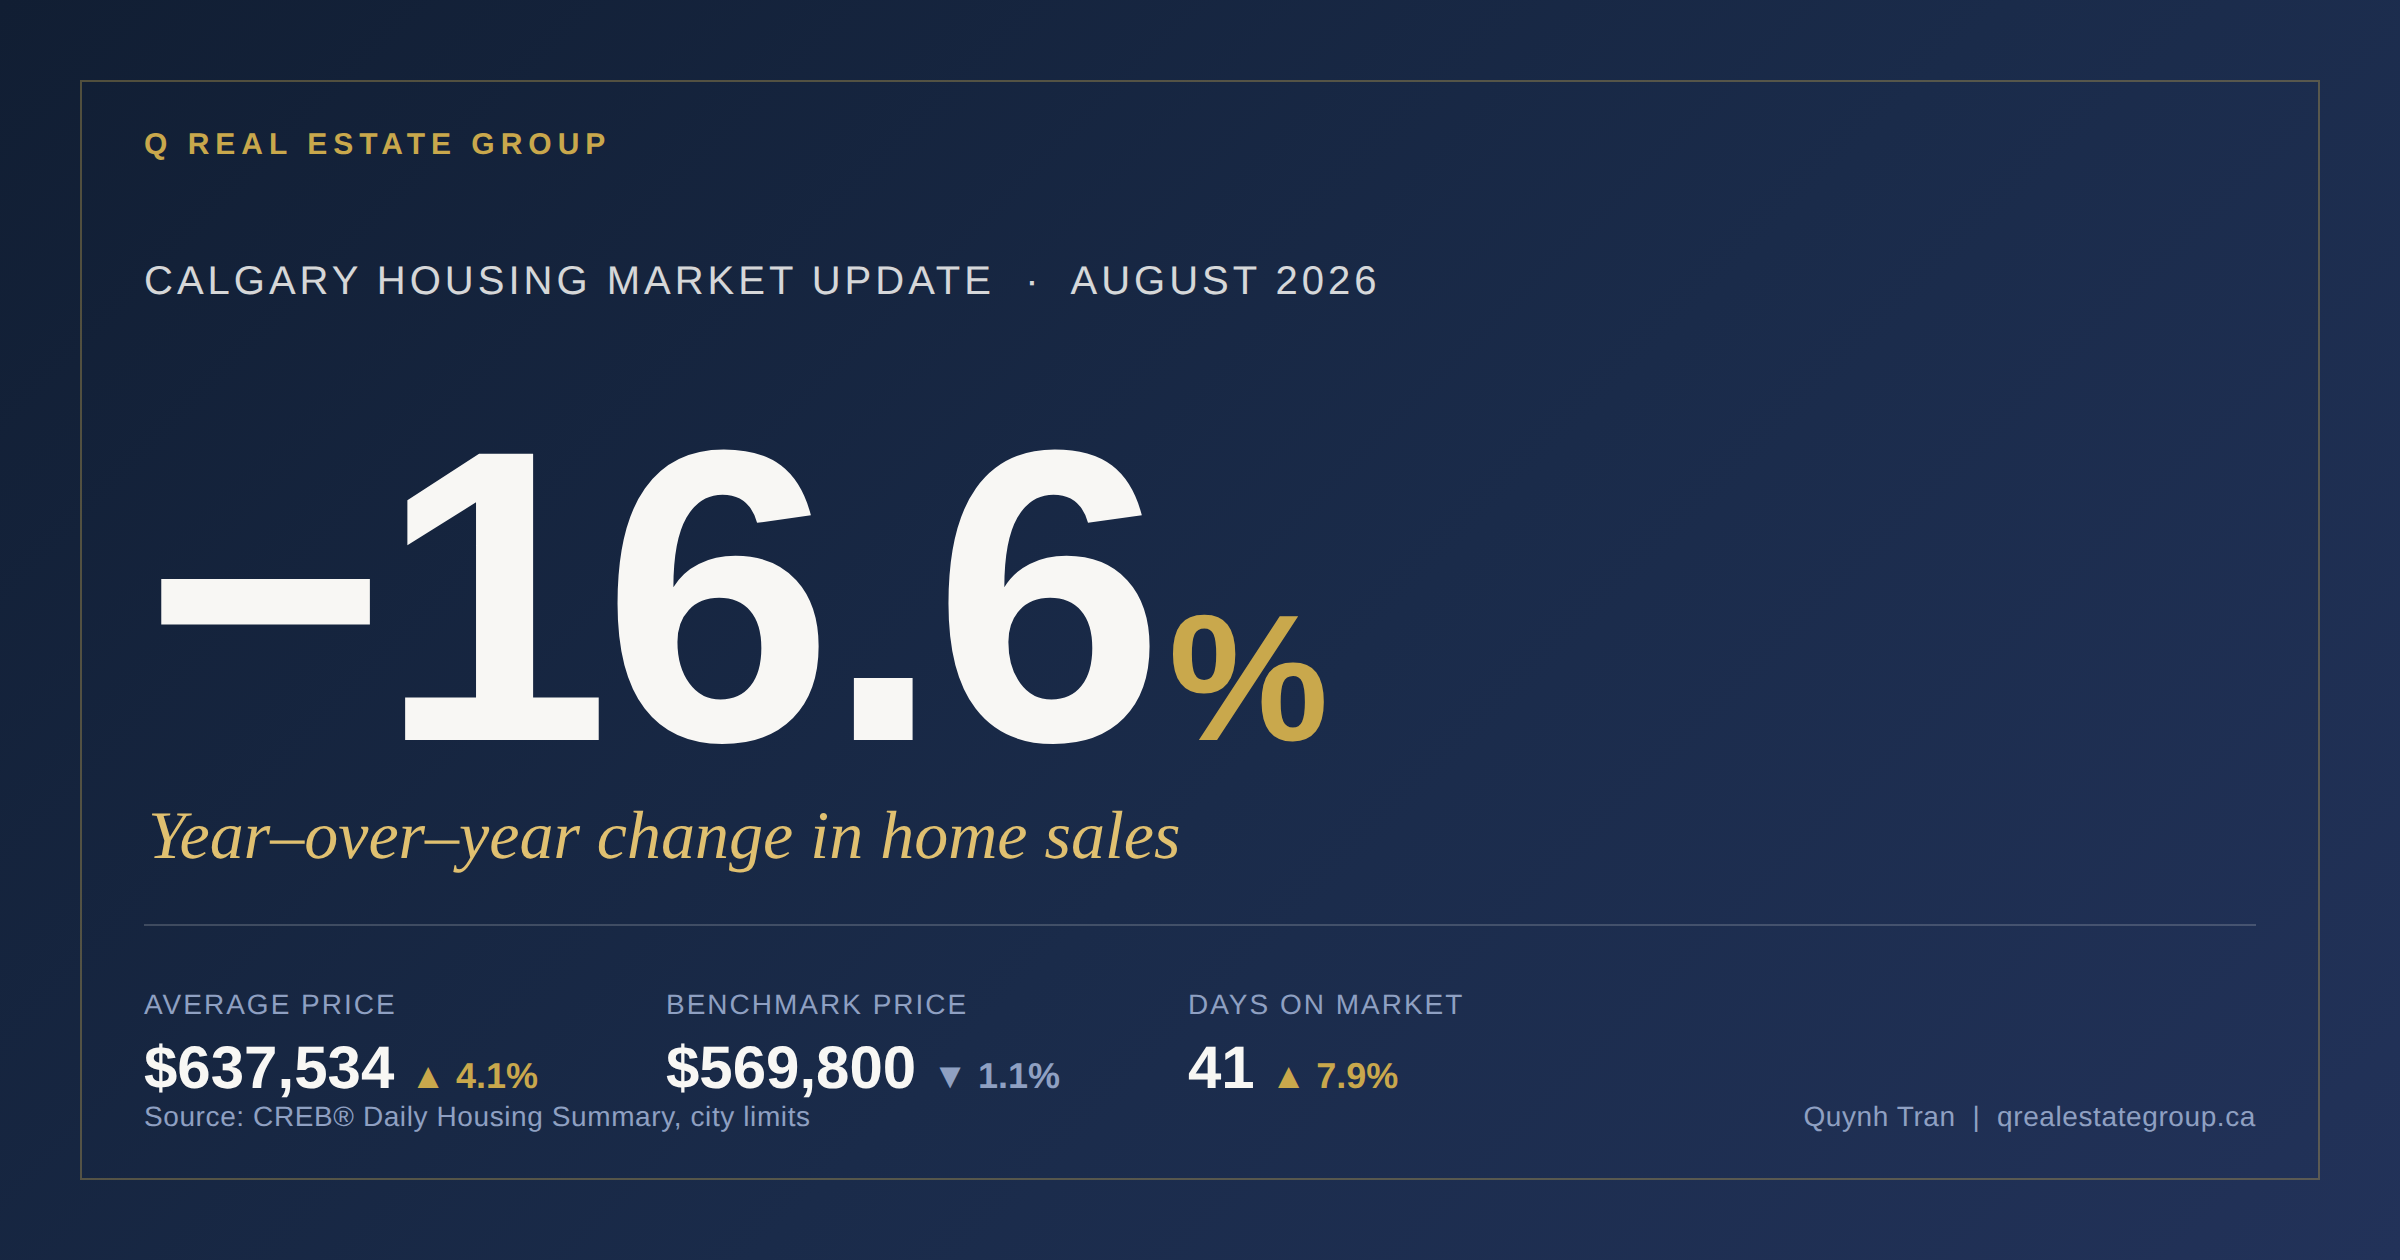
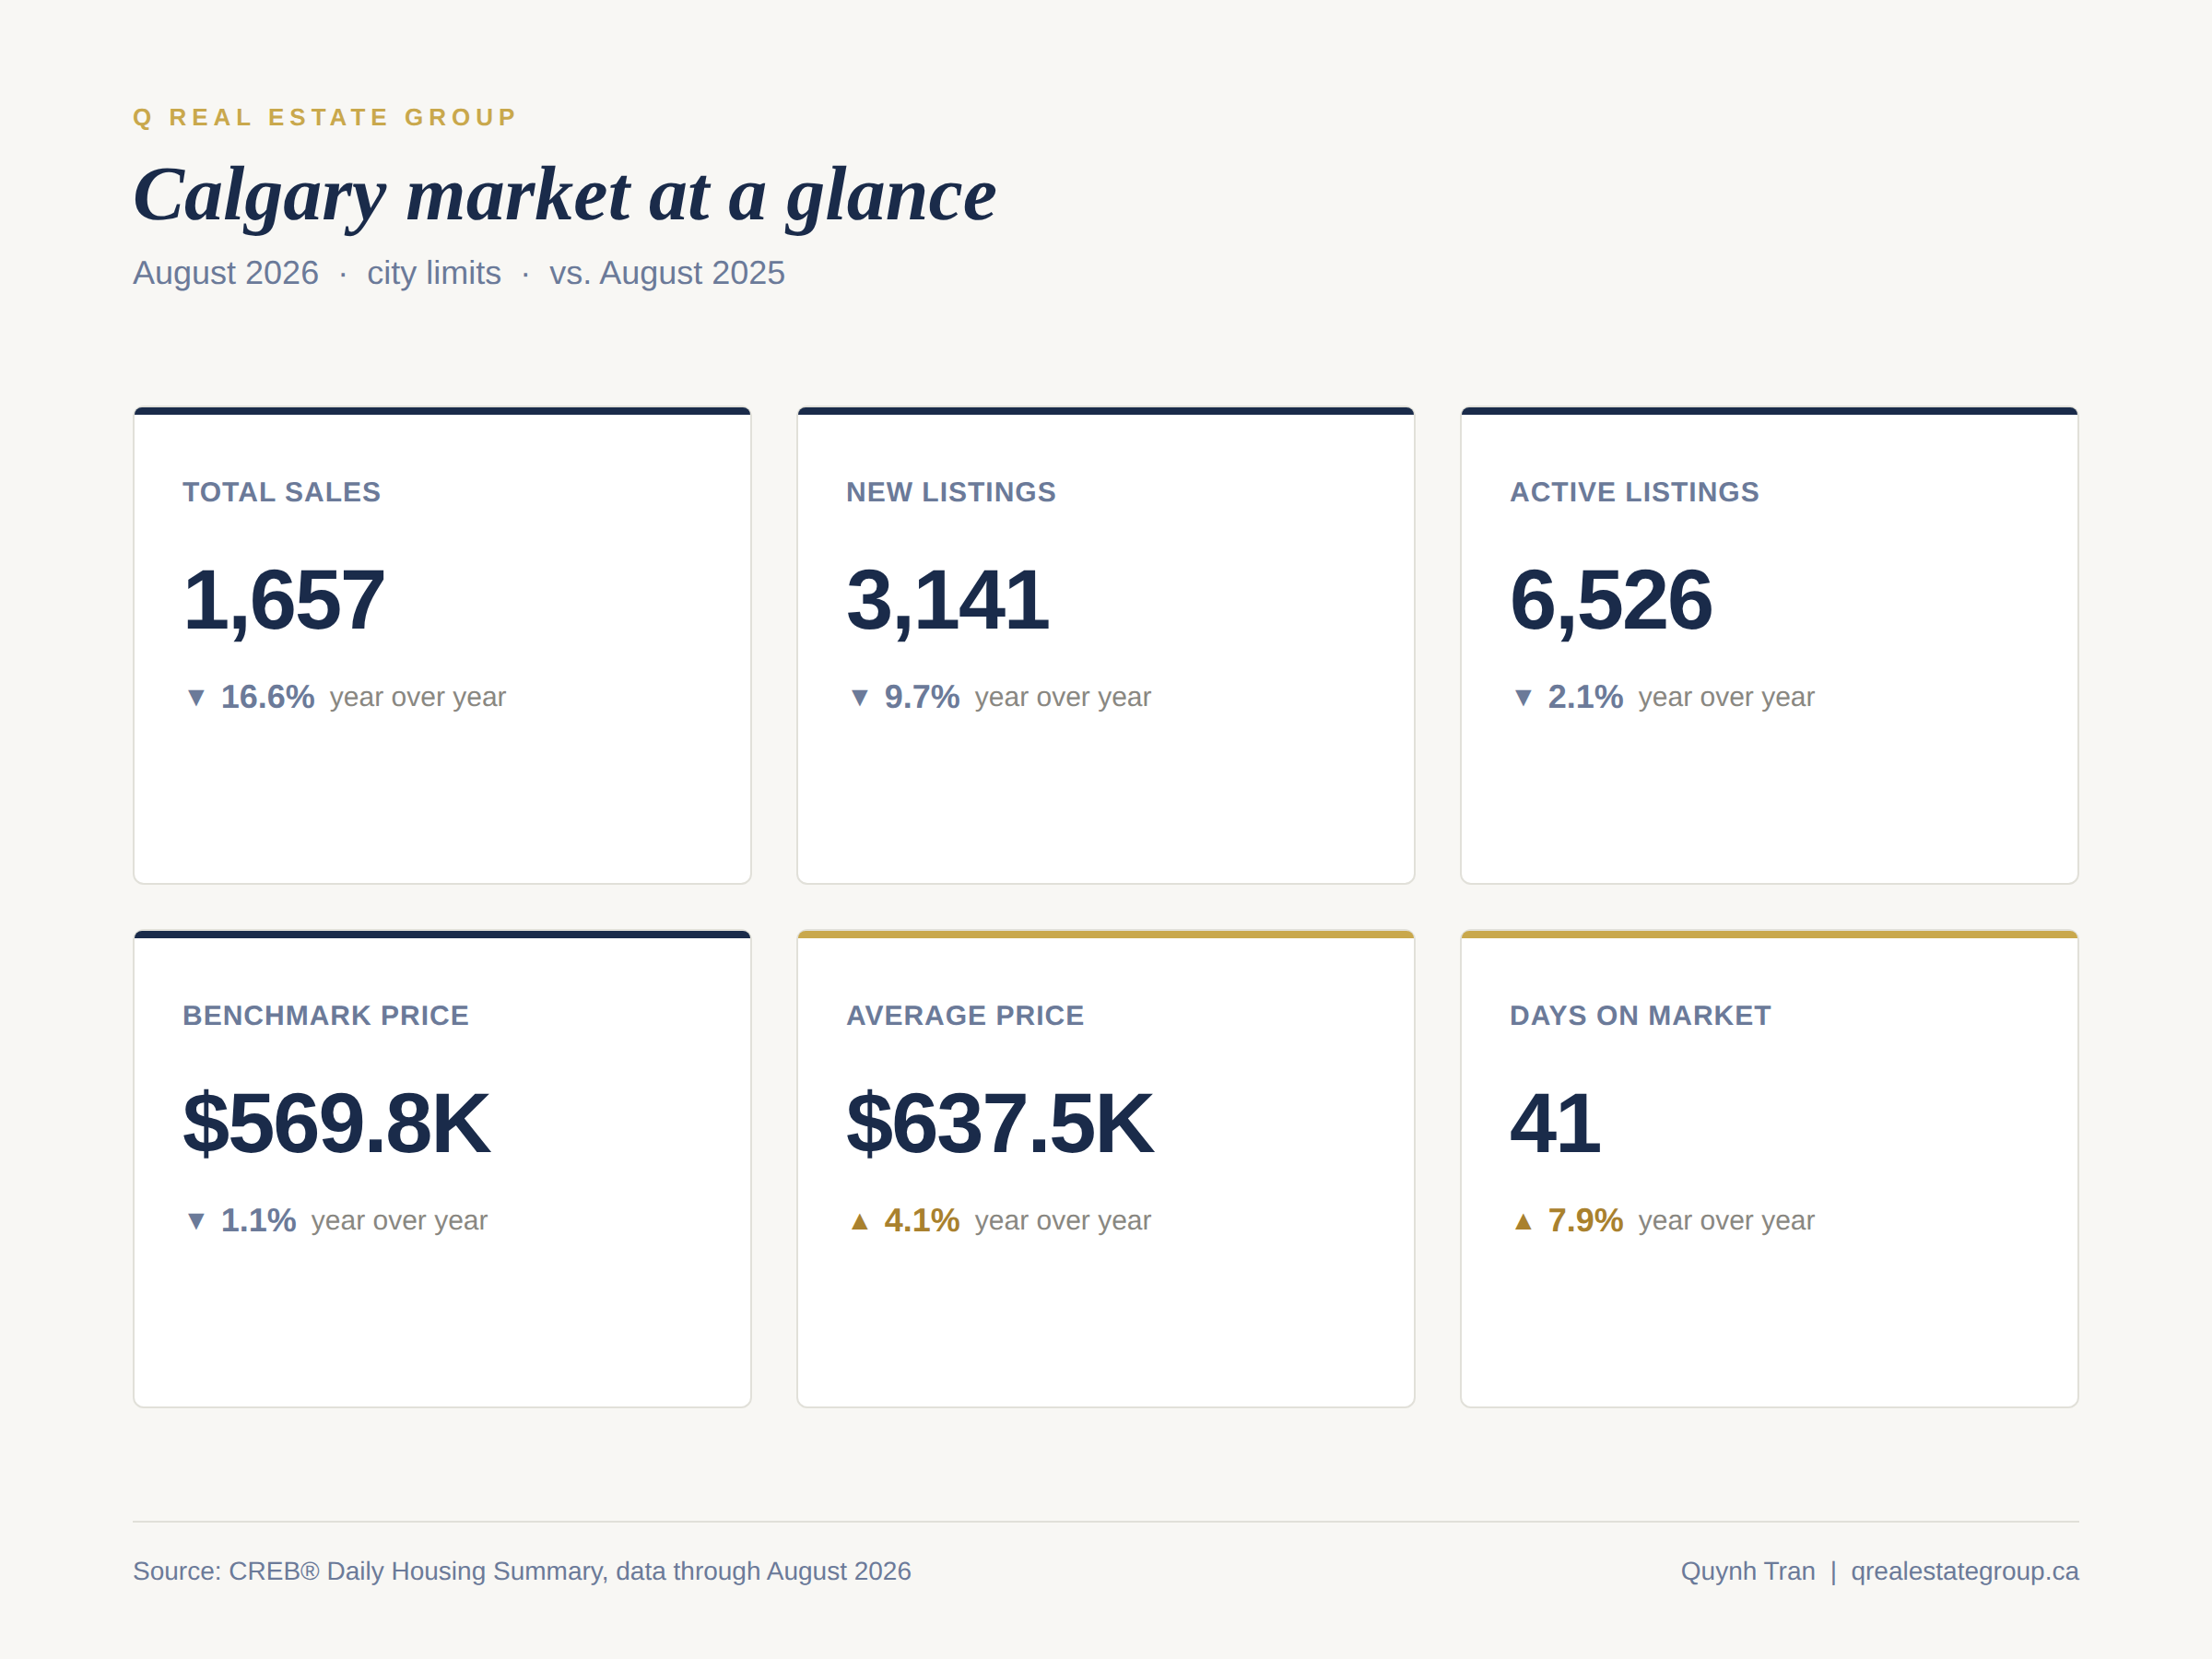
Calgary's resale market cooled further in August. Home sales within city limits came in at 1,657, down 16.6 percent from August 2025 and the slowest August I've tracked in recent years. At the same time, the average sale price climbed to $637,534, up 4.1 percent year over year. Those two numbers moving in opposite directions is the story of this month: fewer transactions, but a different mix of homes changing hands.
Sales and listings both pulled back
New listings were down too, at 3,141 for the month, a 9.7 percent drop from a year earlier. Because new supply eased roughly in step with slower sales, active listings barely moved: 6,526 homes on the market at month's end, down just 2.1 percent from August 2025. That's worth noting on its own — a market with fewer sales usually sees inventory pile up, and that isn't really happening here. Sellers are pulling back on listing at the same pace buyers are pulling back on purchasing.
Homes also took longer to sell. Days on market averaged 41, up from 38 a year ago and up nearly 8 percent.
Prices: a mixed picture, not a straight decline
This is where the numbers deserve a closer look rather than a headline. The benchmark price, CREB's measure of a "typical" home, was $569,800 in August, down a modest 1.1 percent year over year. Median price was essentially flat, at $565,000. But average price was up 4.1 percent to $637,534.
When the average rises while the benchmark and median hold steady or soften, it usually points to a shift in what's selling rather than broad price appreciation — more of August's activity happened toward the higher end of the market. I'd read this as a market recalibrating, not one that's broadly gaining or losing value.
A closer look by property type
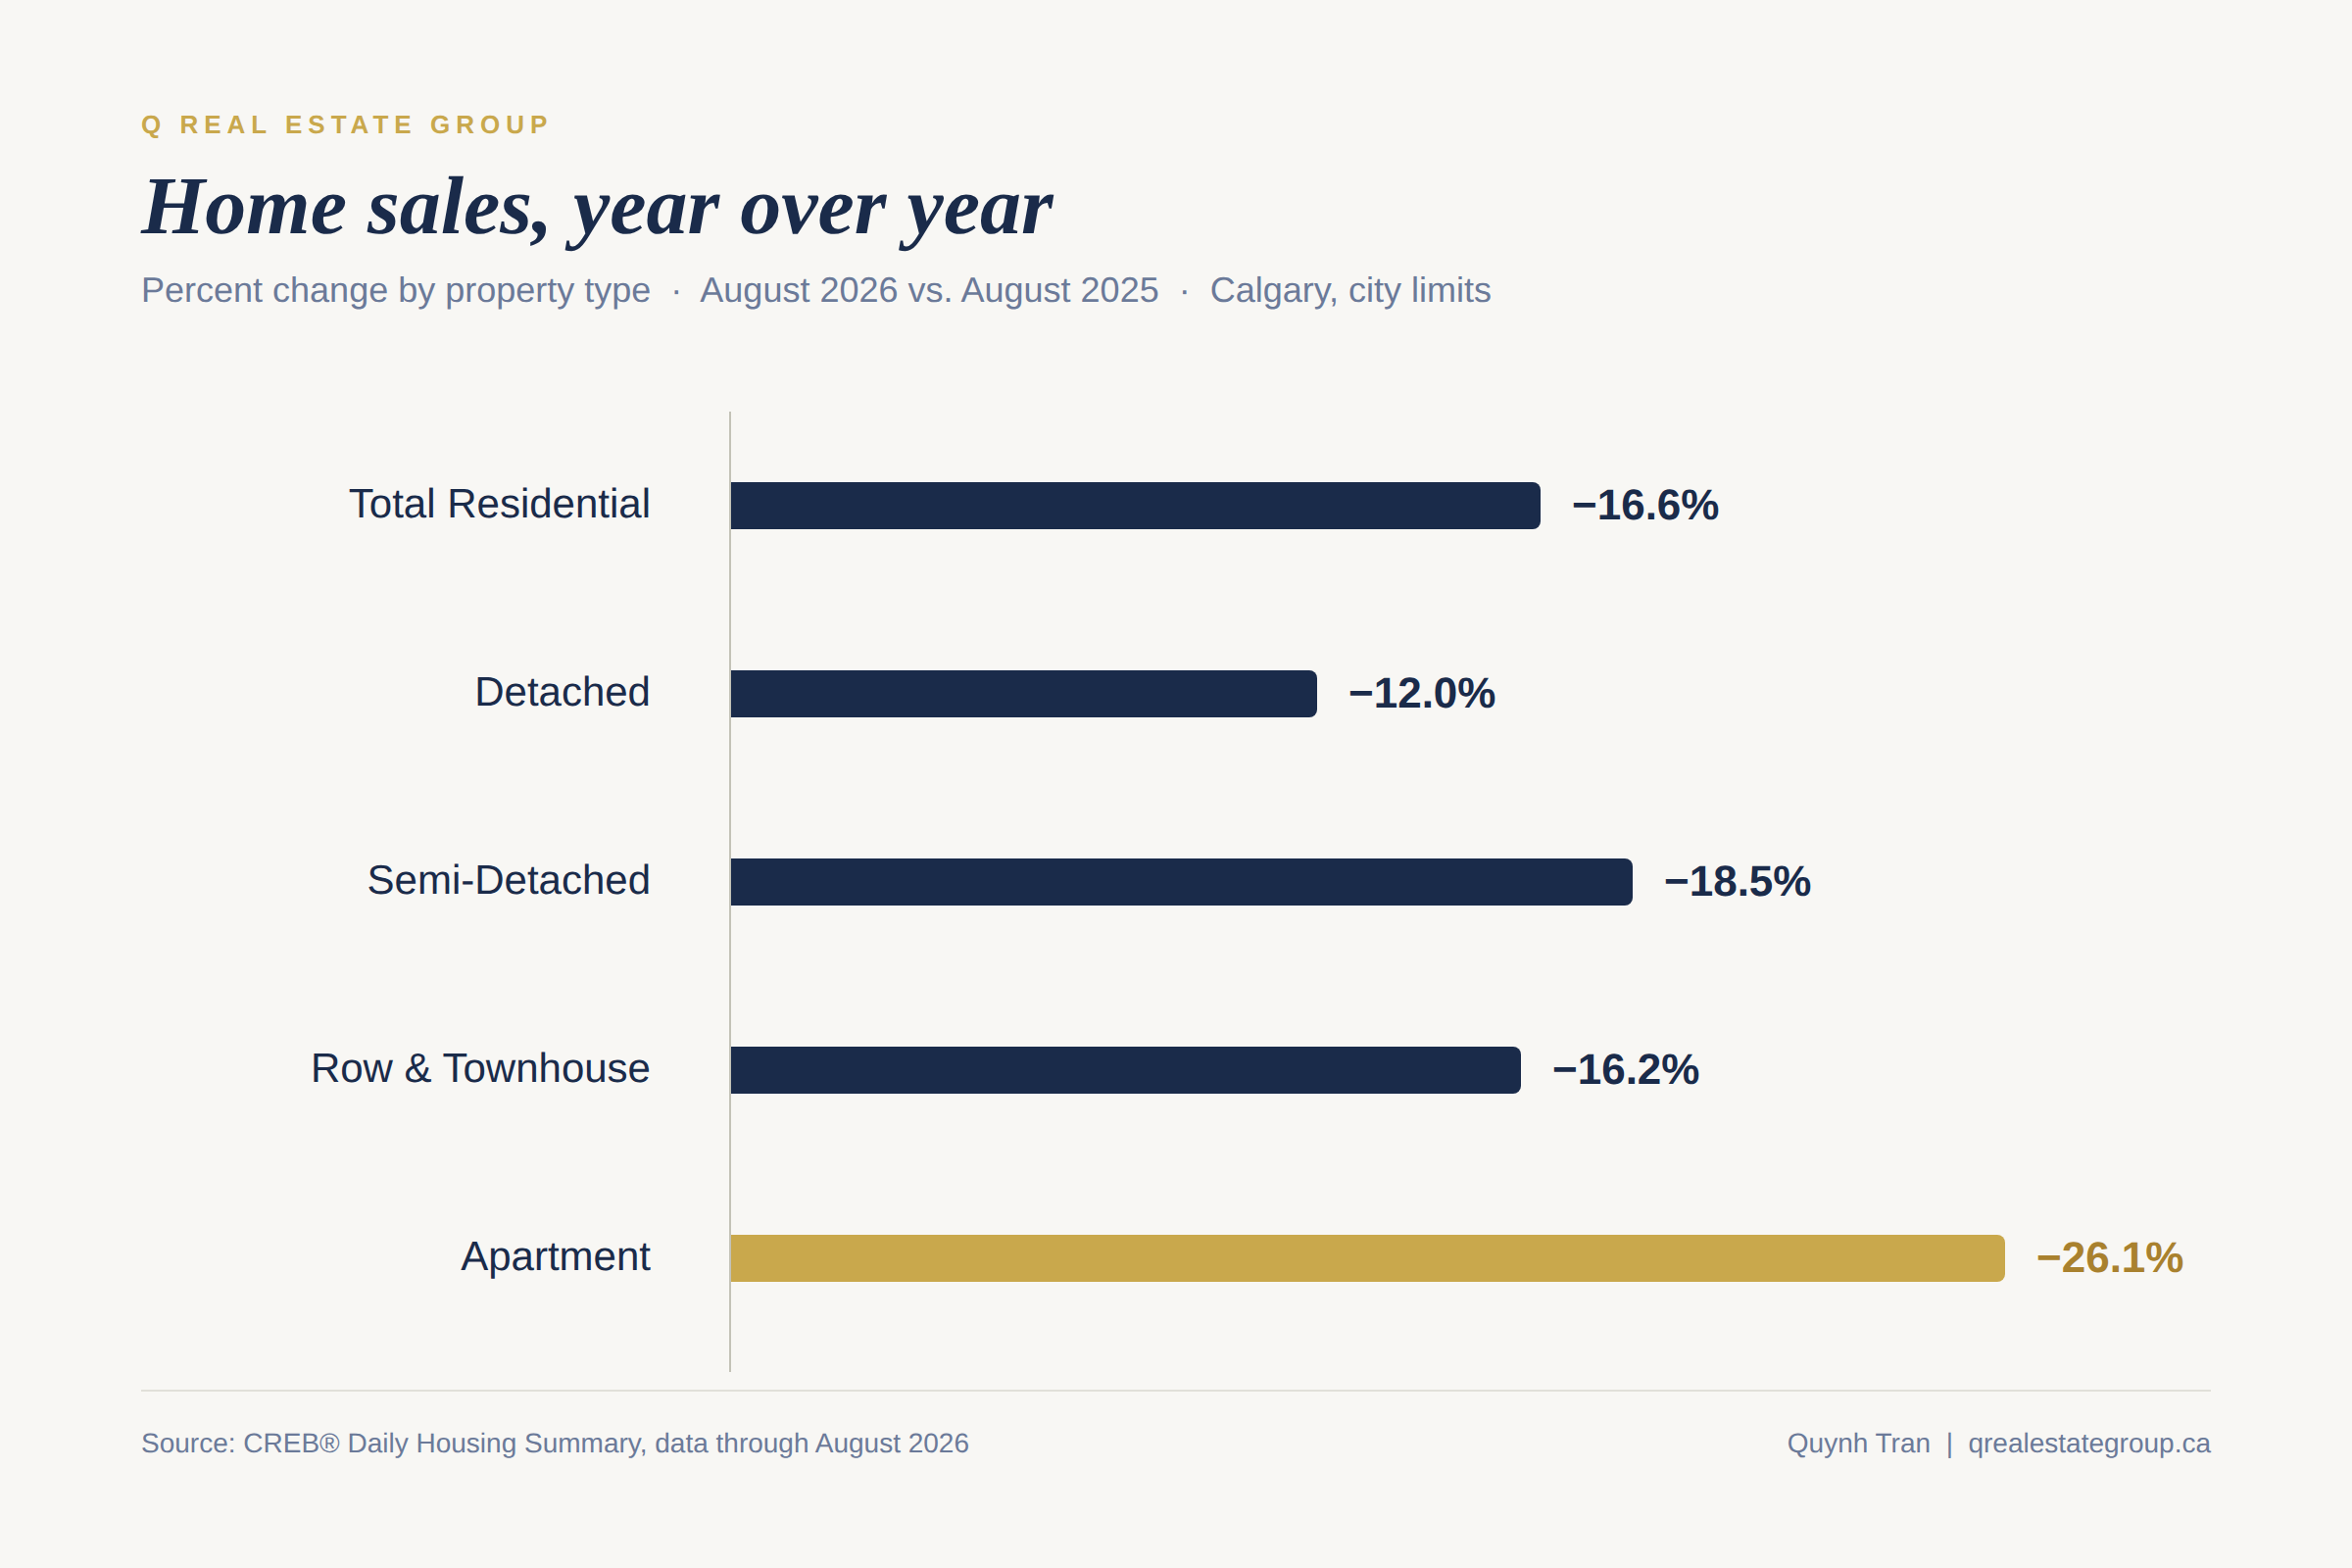
Detached homes: 873 sales (-12.0% year over year), benchmark price $744,300 (-1.1%), average price $811,954 (+3.9%), 35 days on market (unchanged)
Semi-detached homes: 168 sales (-18.5%), benchmark price $690,500 (+1.0%), average price $691,163 (+5.2%), 40 days on market (+14.3%)
Row and townhouse homes: 284 sales (-16.2%), benchmark price $415,200 (-5.4%), average price $444,811 (-3.2%), 47 days on market (+17.5%)
Apartments: 332 sales (-26.1%), benchmark price $295,400 (-8.2%), average price $316,613 (-5.0%), 51 days on market (+8.5%)
The apartment segment saw the steepest pullback on every measure — sales, pricing, and time on market all moved the most here. Detached homes held up the best of the four, with pricing essentially stable and the smallest increase in days on market.
What this means if you're buying
Conditions are tilting your way. Sales are down, homes are sitting longer, and pricing in the condo and townhouse segments has softened meaningfully. That said, inventory isn't flooding the market — sellers are being just as selective about listing as buyers are about purchasing — so this isn't a market where you can expect to have your pick of everything sitting unsold. It's a market that rewards patience and a clear sense of what you're looking for.
What this means if you're selling
Pricing accurately matters more in this kind of market than it did a year or two ago. The benchmark and median figures suggest buyers are still transacting at fair value, but the longer days-on-market number across every property type is a signal that overpricing gets punished with time sitting rather than a quick sale. If you're in the detached segment, pricing has held up best; if you're in a condo or townhouse, expect more negotiation and a longer runway to close.
Year-to-date context
Zooming out, 2026 year-to-date sales sit at 15,350, down 10.6 percent from the same point in 2025, on 9.9 percent fewer new listings. Median price is flat year over year at $580,000, while average price is up 2.4 percent to $645,639. Days on market year-to-date is up nearly 15 percent, at 39. The pattern holding all year is consistent with what August shows: a market with less transaction volume, roughly stable typical pricing, and more time required to get a deal done.
If you're weighing a move in this market — whether you're buying, selling, or just want to understand what these numbers mean for your specific property or neighbourhood — I'm happy to walk through it with you.
Source: Calgary Real Estate Board (CREB®) Daily Housing Summary, data through August 2026, properties within city limits.
FAQ Section (for GEO)
Are home prices dropping in Calgary right now? Not broadly. Benchmark price was down 1.1 percent and median price down 0.8 percent year over year in August 2026, while average sale price was up 4.1 percent — a sign of a shift in what's selling rather than a market-wide price decline. Condo and townhouse pricing softened the most; detached home pricing held closest to flat.
Is it a buyer's market in Calgary in 2026? Conditions are shifting toward buyers, with sales down 16.6 percent year over year and days on market up to 41. However, inventory hasn't built up significantly because new listings have also slowed, so it isn't a market flooded with unsold homes.
How long does it take to sell a home in Calgary? Homes in Calgary spent an average of 41 days on market in August 2026, up from 38 days in August 2025. Apartments and row/townhouse homes are taking longer than detached homes, which averaged 35 days.
What's happening with condo prices in Calgary? The apartment segment saw the sharpest pullback of any property type in August 2026: sales down 26.1 percent year over year, benchmark price down 8.2 percent, and average price down 5.0 percent.
Is now a good time to sell a home in Calgary? Typical pricing (benchmark and median) has held relatively steady, which is good news for sellers, but longer days on market across every property type means accurate pricing from the outset matters more than it did a year ago.