
Calgary Housing Market Update: October 2026
Calgary Housing Market Update: October 2026
By Quynh Tran, Realtor, Q Real Estate Group. Data: CREB®, October 2026.
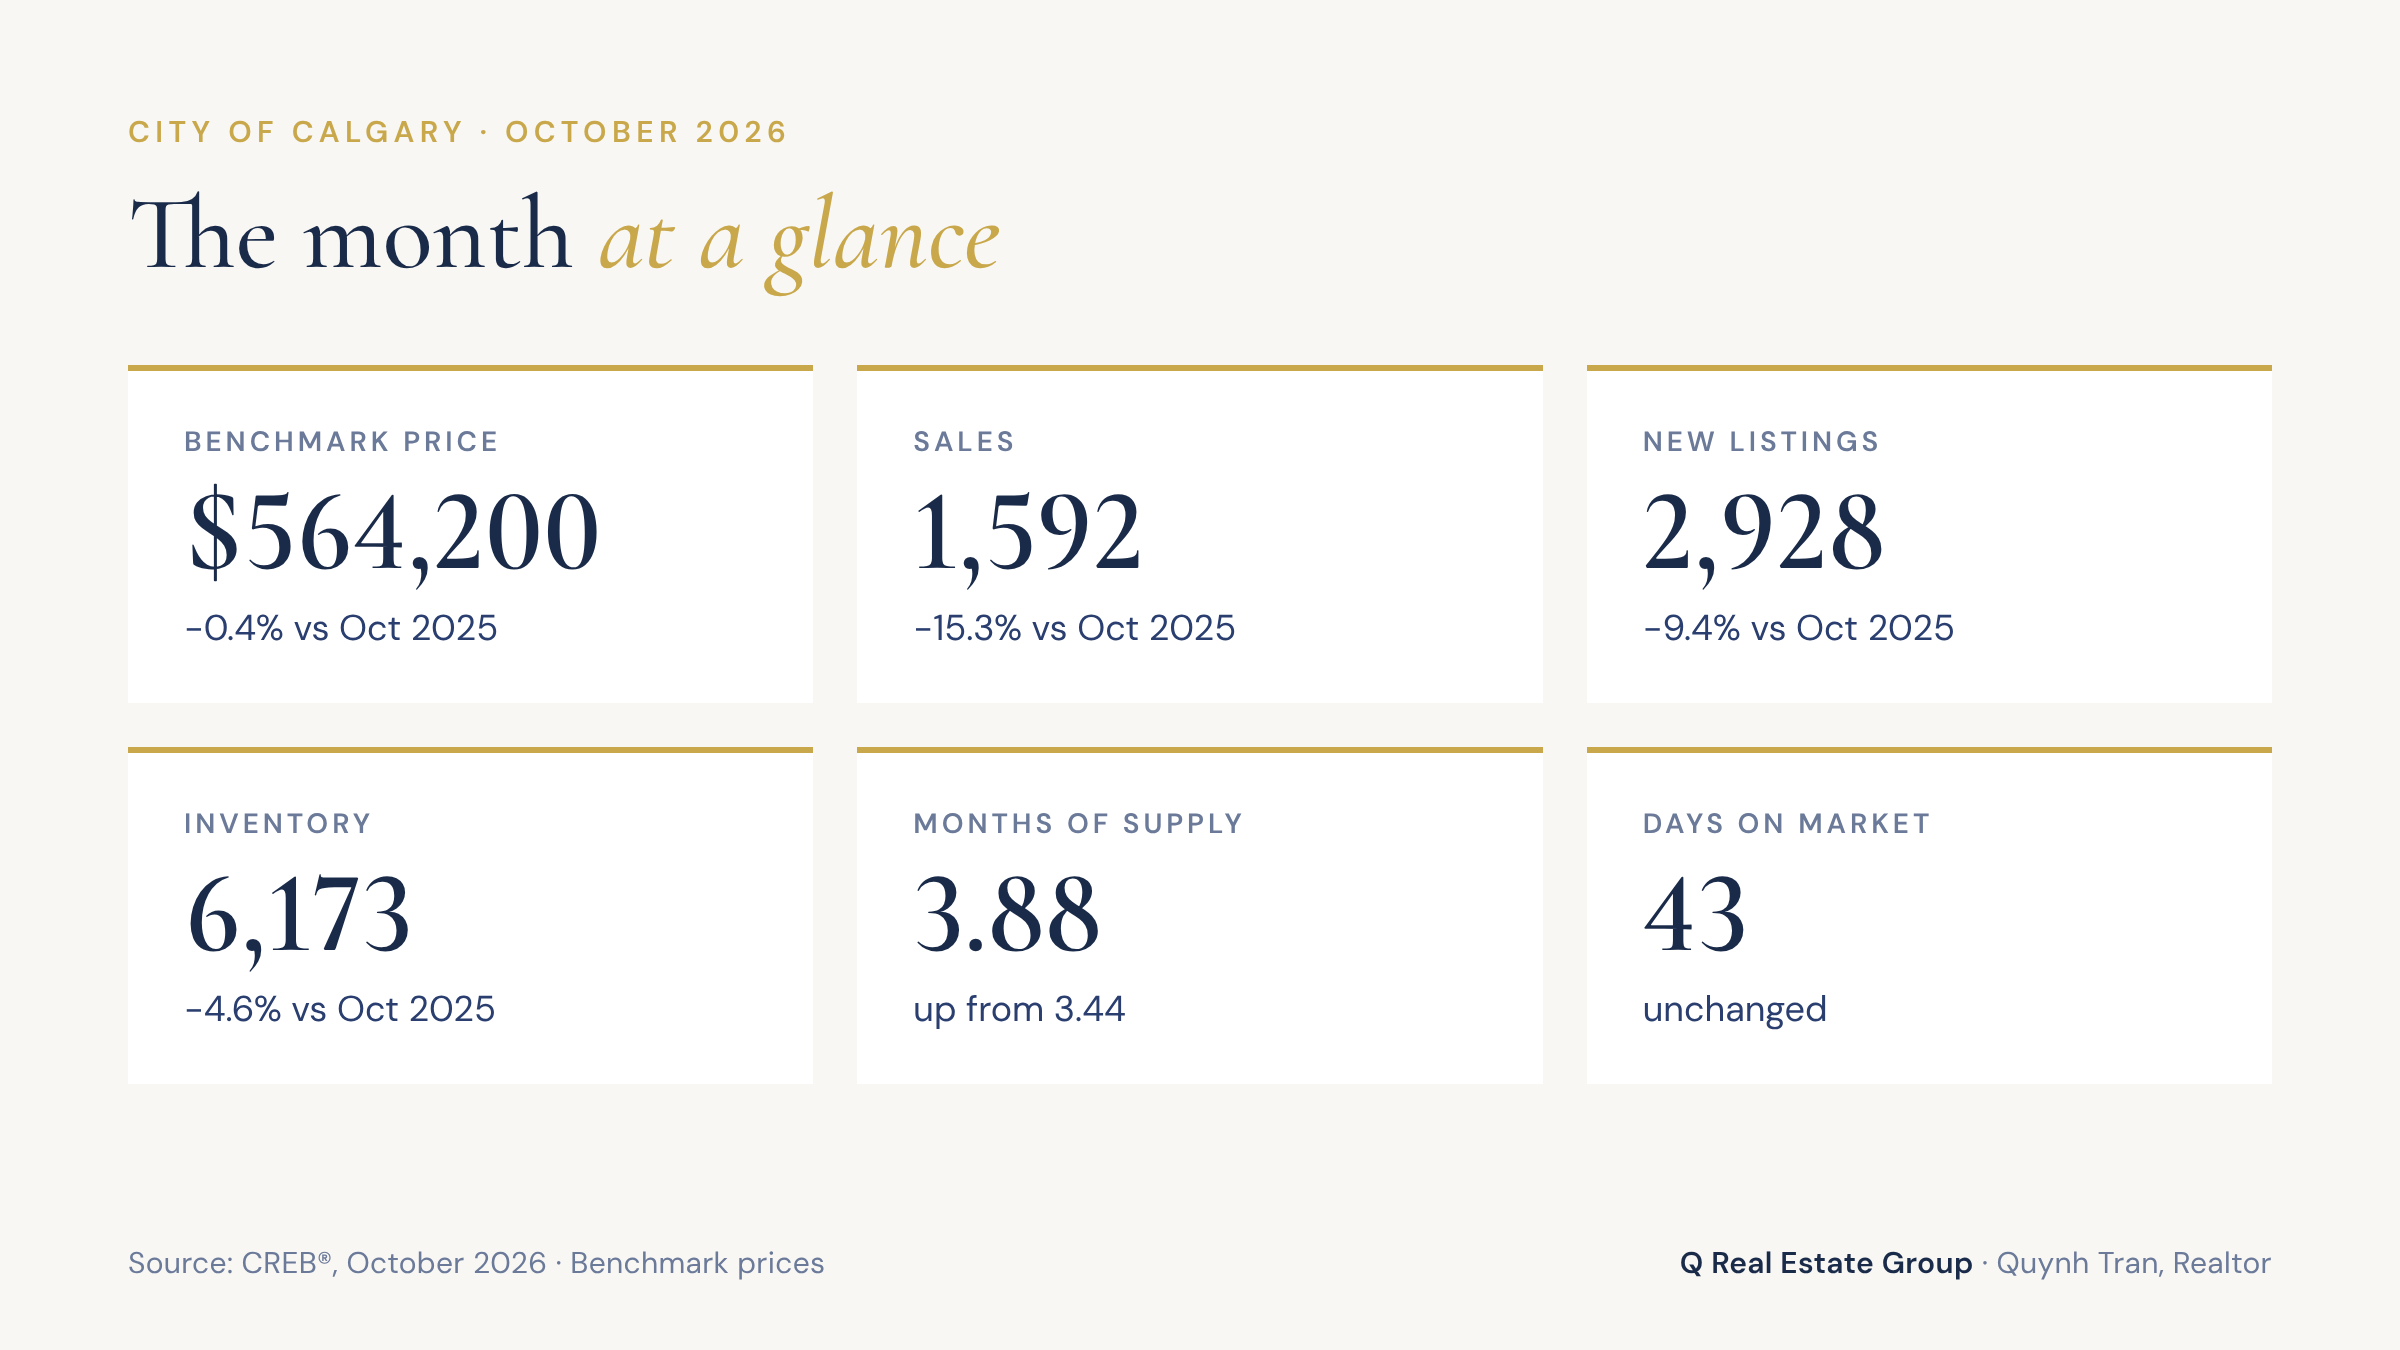
Calgary's total residential benchmark price was $564,200 in October 2026, down 0.4 per cent from October 2025. Sales slowed to 1,592, a 15 per cent drop year over year, while inventory eased to 6,173 homes and months of supply sat just below four. Overall, prices are holding steady, but conditions now look very different from one property type and district to the next.
October 2026 at a glance
Metric | Oct 2026 | Oct 2025 | Change |
|---|---|---|---|
Sales | 1,592 | 1,879 | -15.3% |
New listings | 2,928 | 3,232 | -9.4% |
Inventory | 6,173 | 6,472 | -4.6% |
Months of supply | 3.88 | 3.44 | +12.6% |
Benchmark price | $564,200 | $566,200 | -0.4% |
Median price | $562,500 | $577,000 | -2.5% |
Days on market | 43 | 43 | Unchanged |
Sale-to-list price ratio | 97.3% | 97.4% | -0.1 pts |
Year to date, Calgary has recorded 17,878 sales, nearly 11 per cent fewer than the same period in 2025. The year-to-date benchmark price of $565,680 is about three per cent lower than last year. According to CREB, most of the price adjustment happened in the second half of 2025, and the usual spring lift in prices did not arrive in 2026.
Supply is easing, but it isn't tight
New listings fell alongside sales in October, which pulled inventory down from 6,486 homes in September. That's a typical seasonal pattern heading into winter. Inventory is also almost five per cent lower than last October.
Even so, the sales-to-new-listings ratio was 54 per cent and months of supply rose to 3.88, up from 3.44 a year ago. In plain terms, buyers have more options and more time than they did a year ago.
Prices by property type
Property type | Benchmark price | Change Y/Y | Months of supply | October sales |
|---|---|---|---|---|
Detached | $735,100 | -0.7% | 3.34 | 847 |
Semi-detached | $685,200 | +0.8% | 3.16 | 184 |
Row | $407,500 | -5.1% | 4.44 | 241 |
Apartment | $288,800 | -7.9% | 5.28 | 320 |
Detached homes remain relatively balanced. Sales fell 16 per cent from last October, but with just over three months of supply, prices are only slightly below last year. Year to date, gains in the City Centre and West have been outweighed by declines in the North East, North and East districts.
Semi-detached homes were the one property type where sales improved from September. The sales-to-new-listings ratio reached 61 per cent, the highest of the four types, and the benchmark price is up 0.8 per cent from last year.
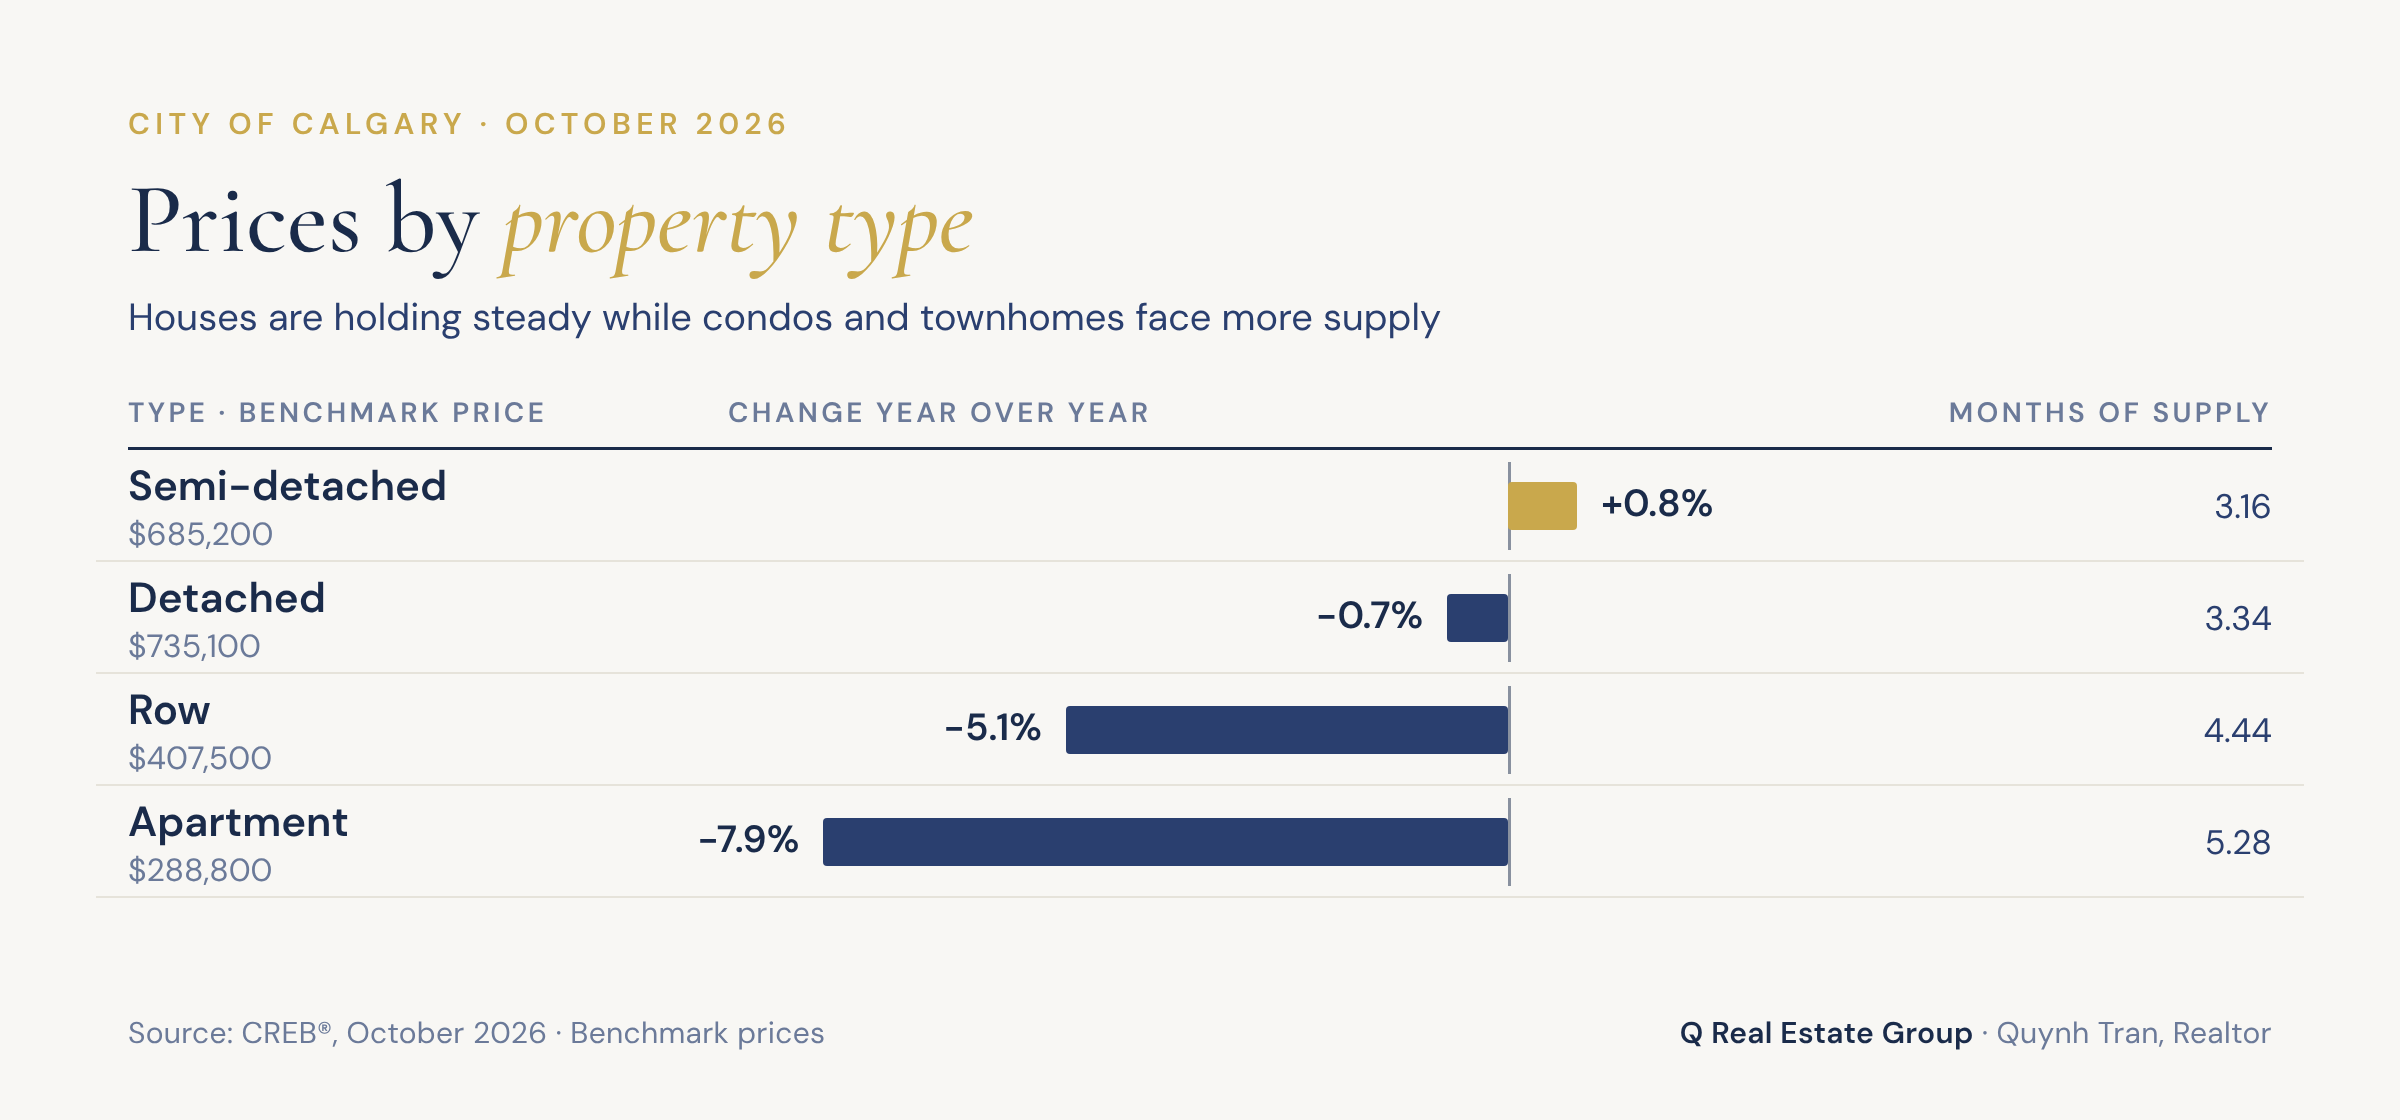
Row homes are seeing more persistent oversupply. Months of supply climbed to 4.44 and the benchmark price is down five per cent from last October. CREB points to competition from new construction and added rental supply as key pressures.
Apartment condominiums have the most supply of any segment at more than five months. The benchmark price is eight per cent lower than last year and 15 per cent below its August 2024 peak. Every district has seen apartment prices ease, with the steepest declines in the North East and East.
Prices by district
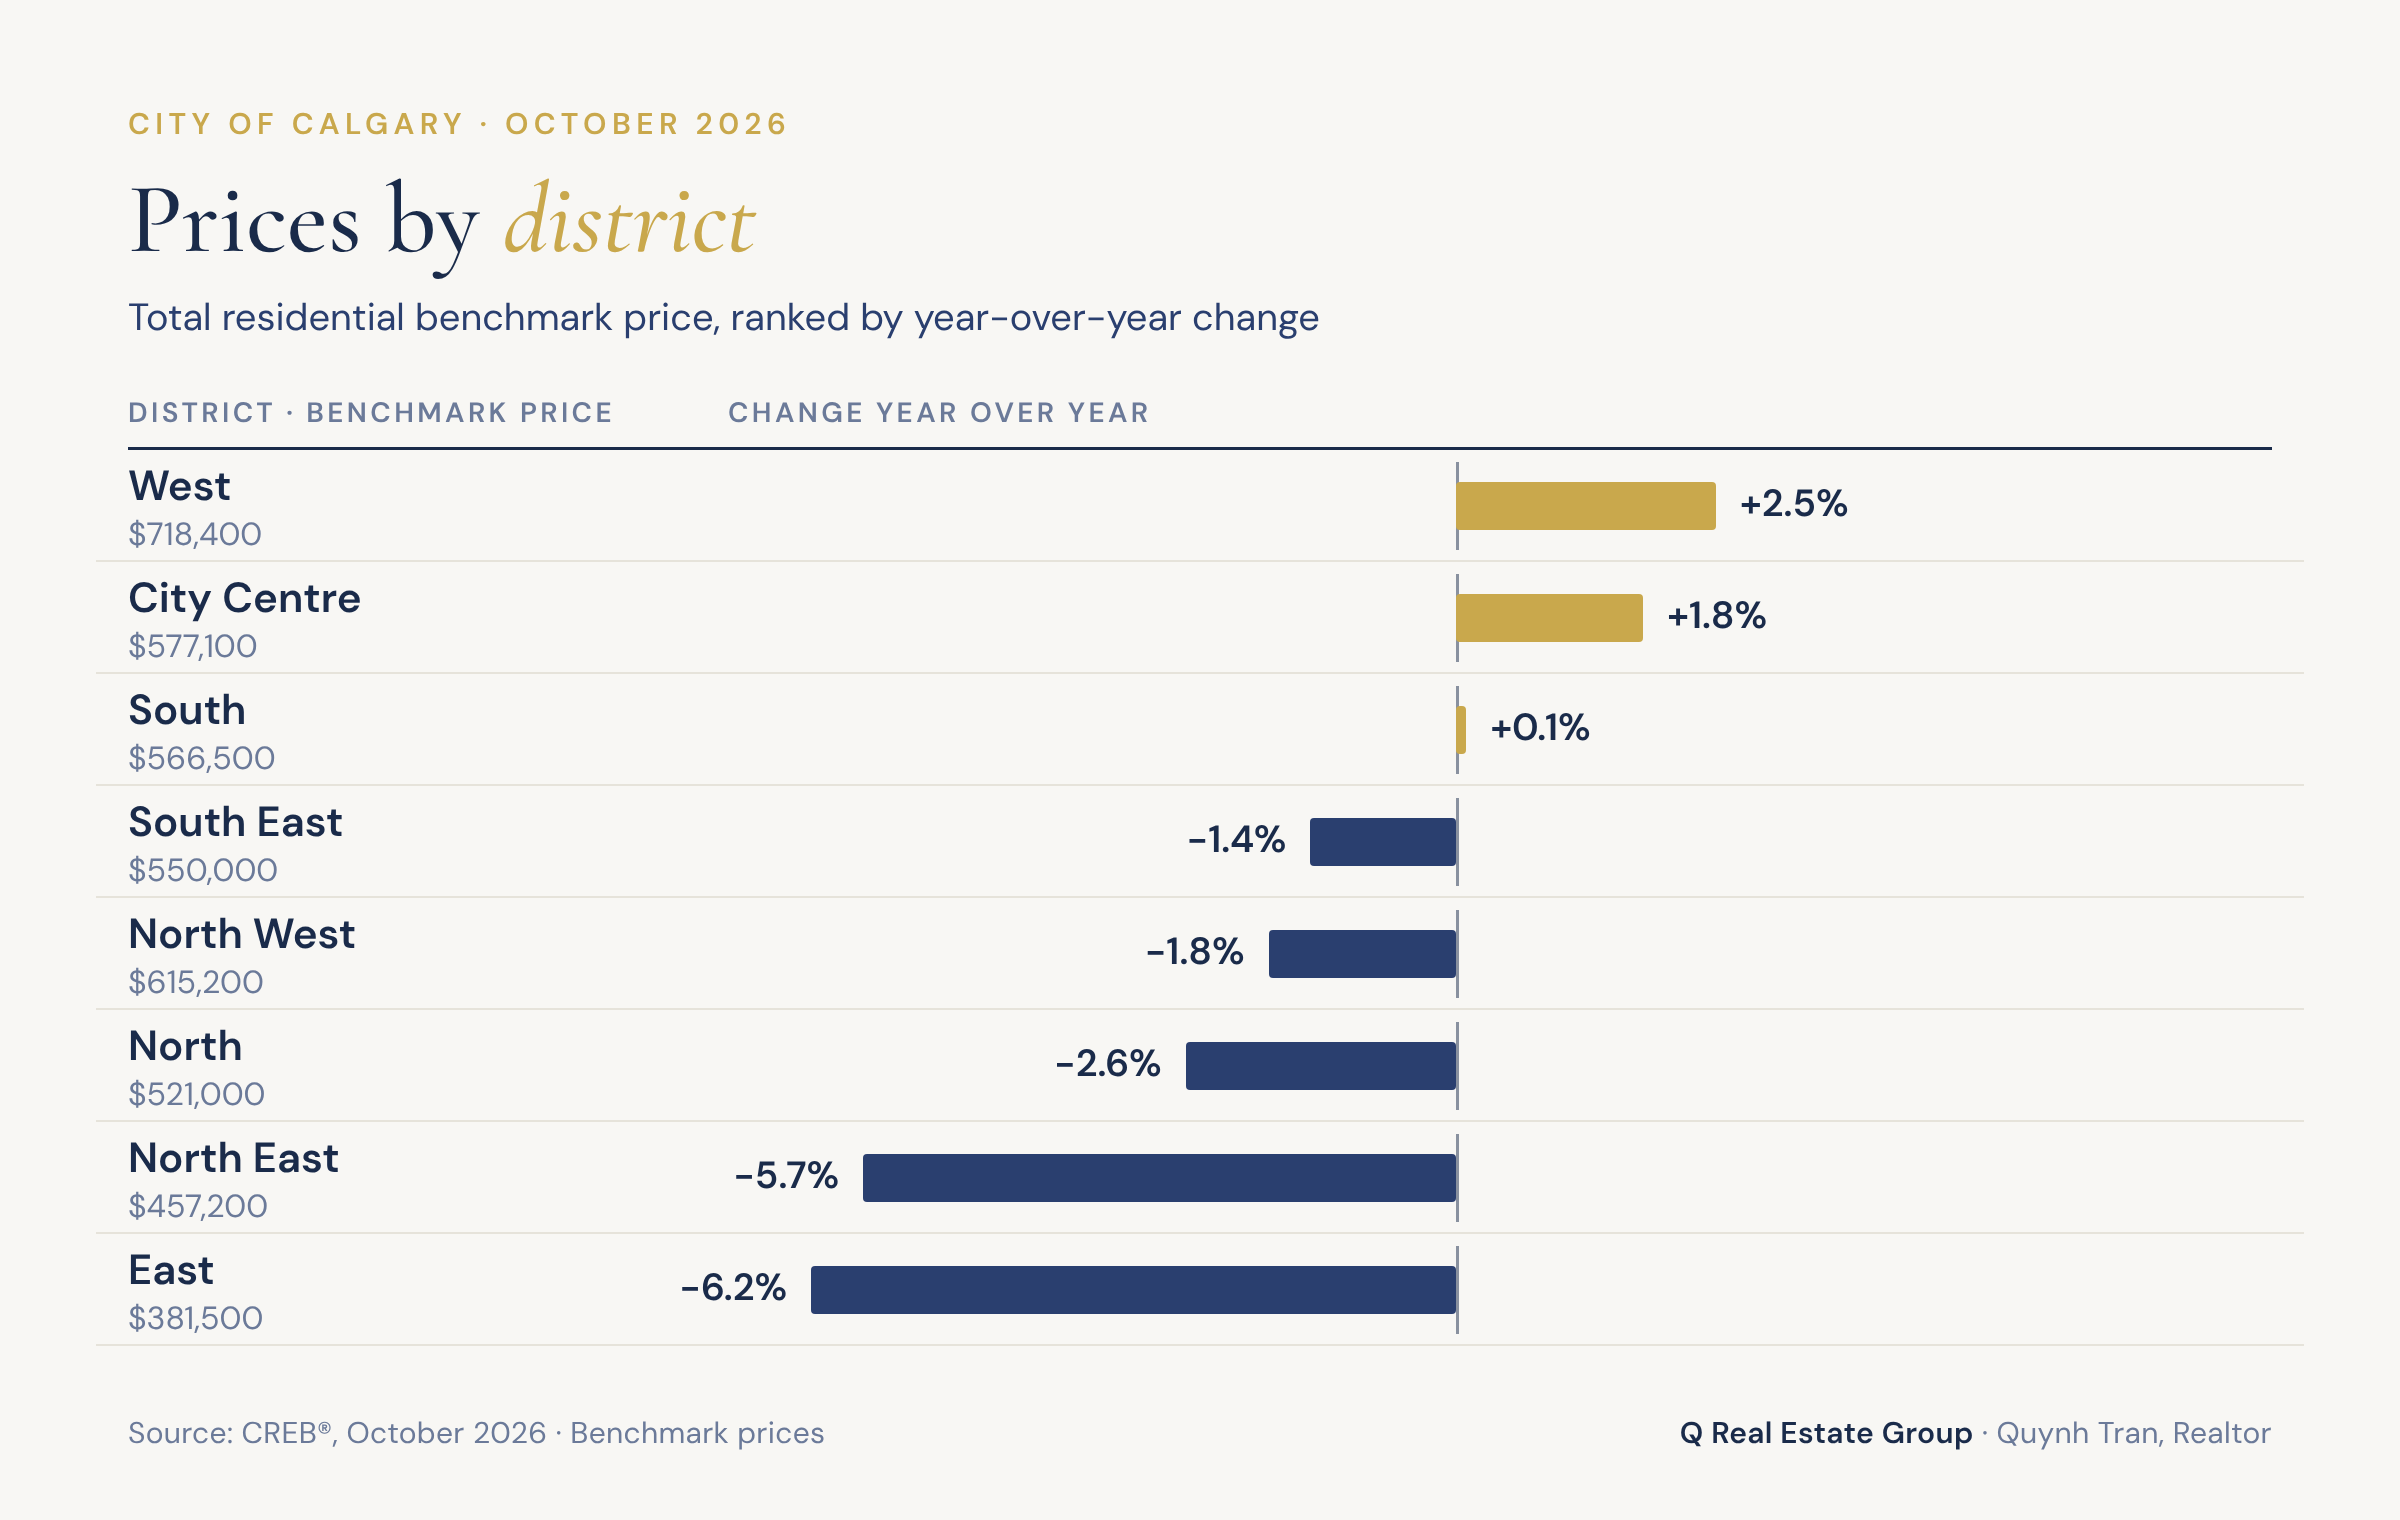
District | Total benchmark price | Change Y/Y |
|---|---|---|
West | $718,400 | +2.5% |
City Centre | $577,100 | +1.8% |
South | $566,500 | +0.1% |
South East | $550,000 | -1.4% |
North West | $615,200 | -1.8% |
North | $521,000 | -2.6% |
North East | $457,200 | -5.7% |
East | $381,500 | -6.2% |
The split is sharpest for detached homes. The detached benchmark price rose 3.3 per cent in the City Centre ($992,500) and 3.2 per cent in the West ($988,400), while it fell 6.6 per cent in the North East ($548,000) and 6.8 per cent in the East ($463,800). Two homes at a similar price point can be in very different markets depending on where they sit in the city.
The upper end is busier
While overall sales are down, homes priced above $1.5 million are selling more often. There were 69 sales above $1.5 million in October, compared with 57 last October. Year to date, 632 homes have sold in that range, up about 21 per cent from 524 in 2025. These sales still make up less than four per cent of all activity.
Around Calgary
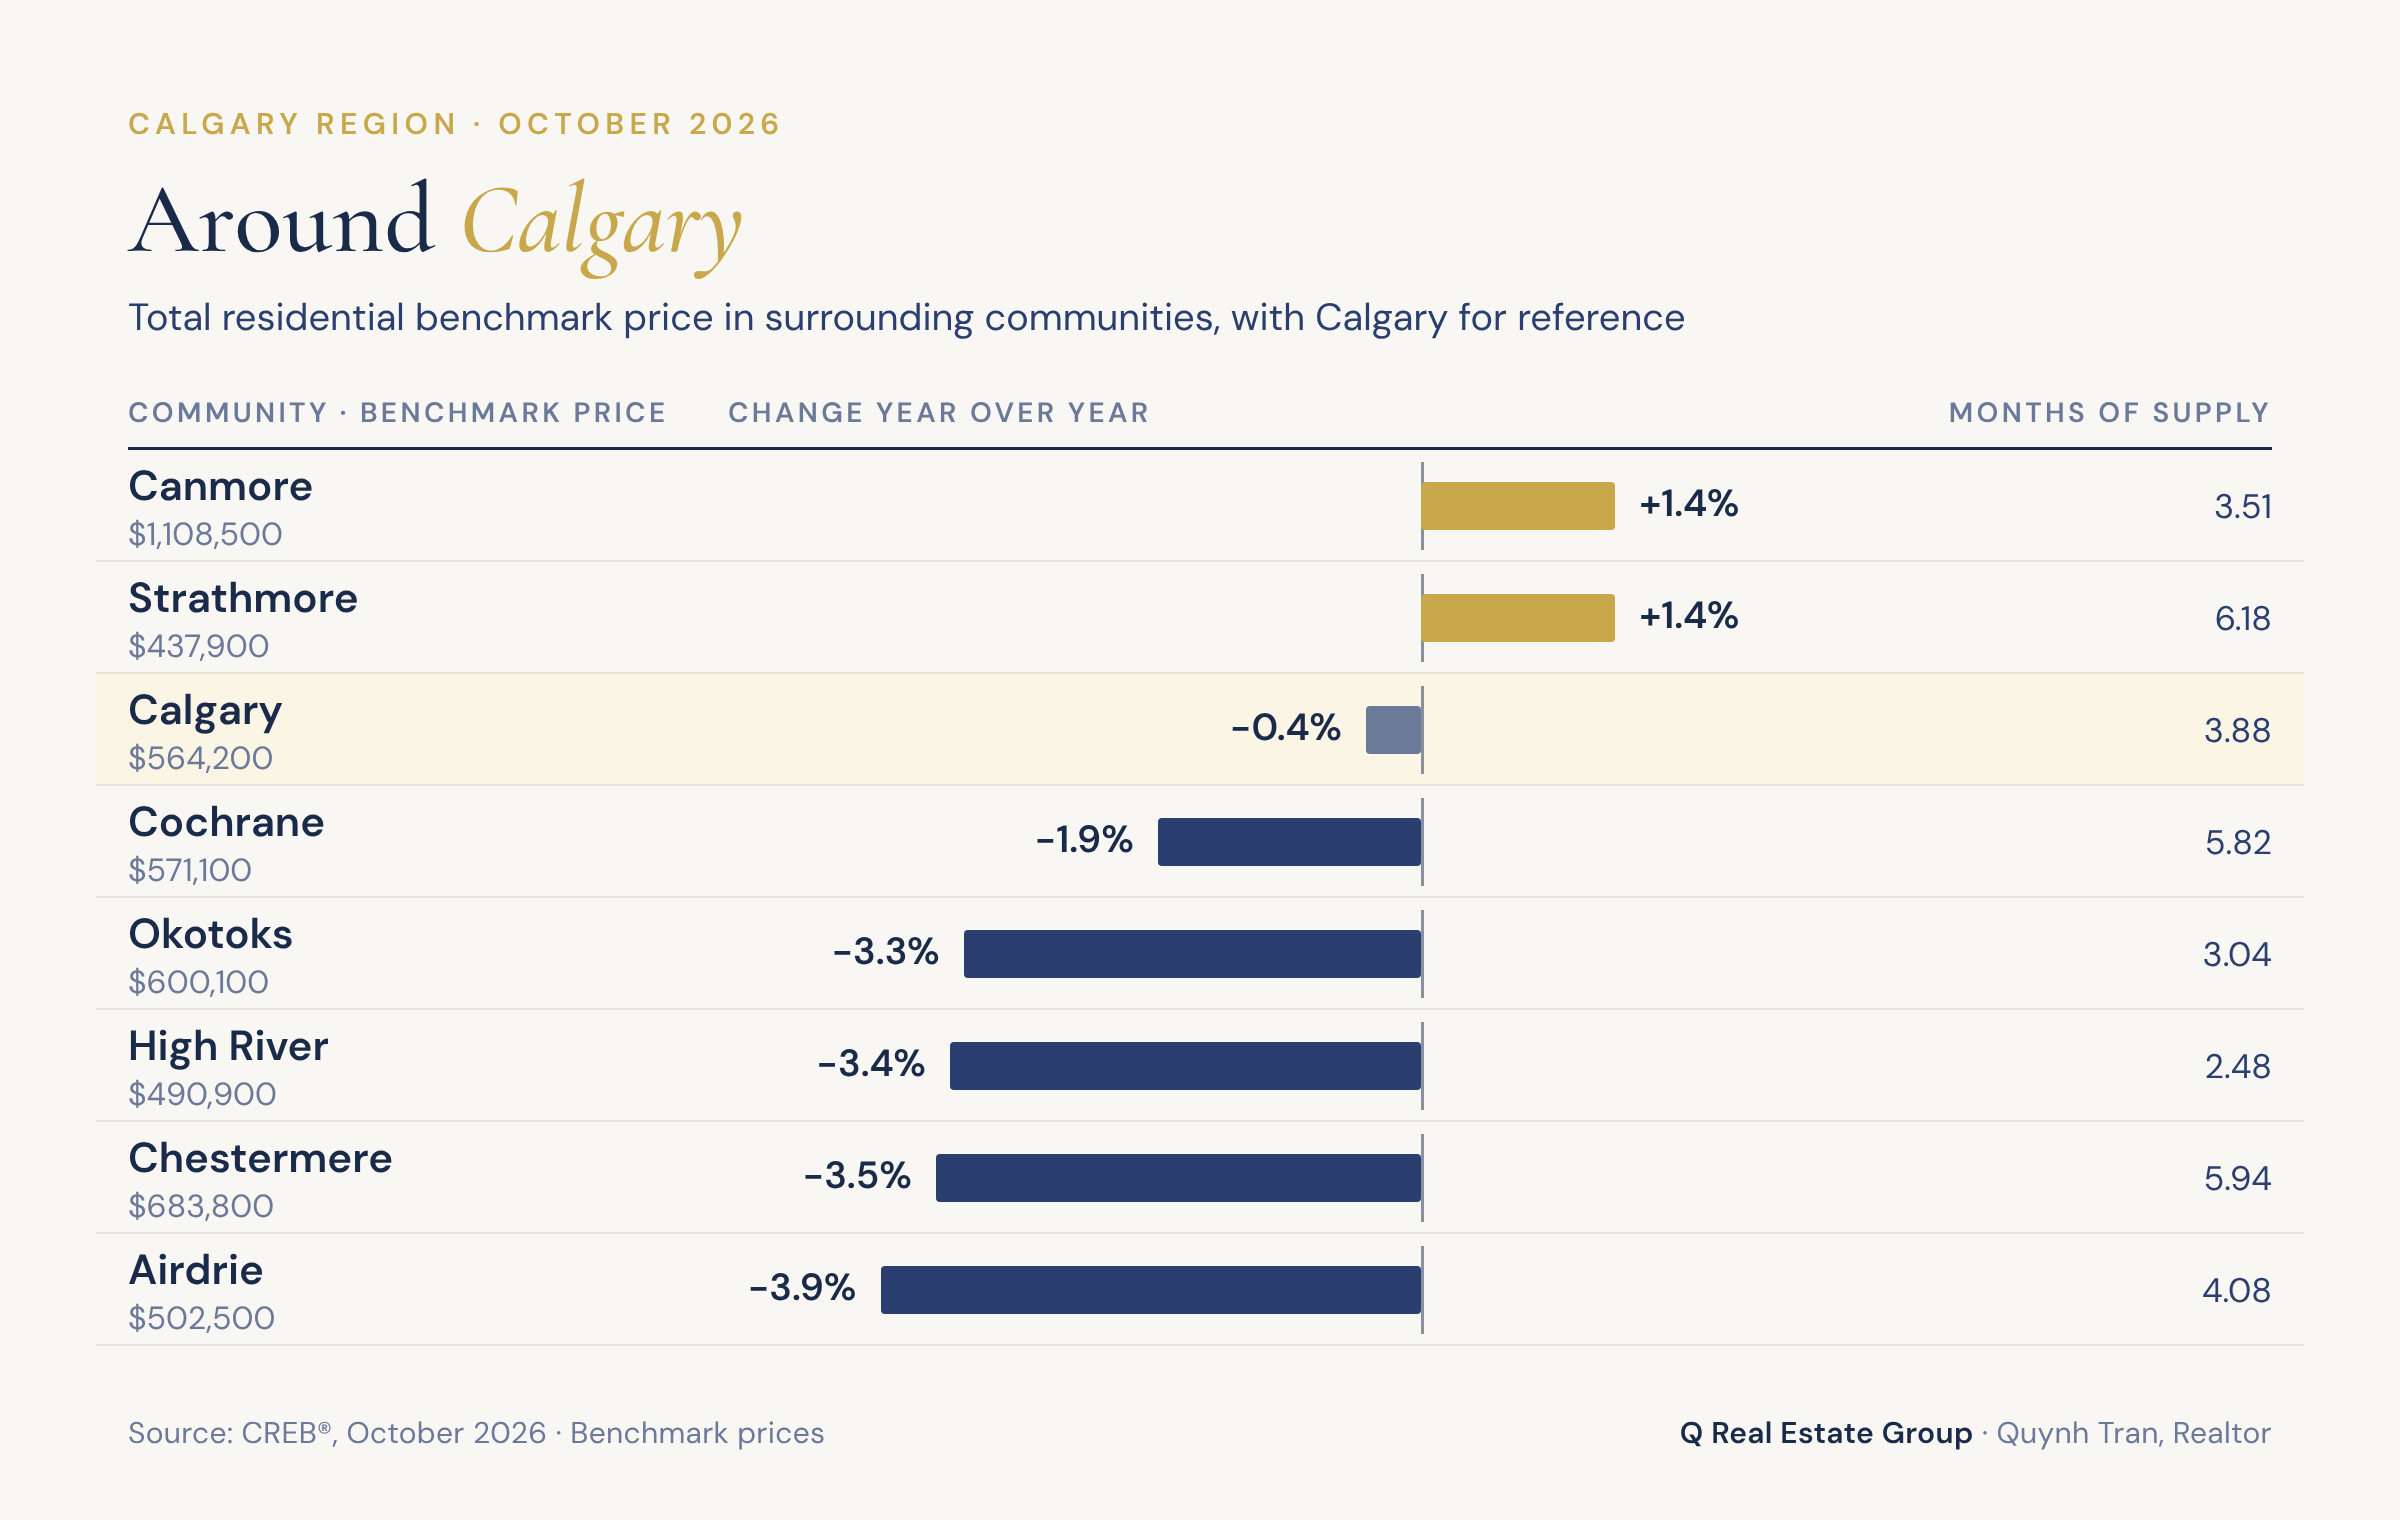
Community | Benchmark price | Change Y/Y | Months of supply |
|---|---|---|---|
Canmore | $1,108,500 | +1.4% | 3.51 |
Chestermere | $683,800 | -3.5% | 5.94 |
Okotoks | $600,100 | -3.3% | 3.04 |
Cochrane | $571,100 | -1.9% | 5.82 |
Airdrie | $502,500 | -3.9% | 4.08 |
High River | $490,900 | -3.4% | 2.48 |
Strathmore | $437,900 | +1.4% | 6.18 |
Most surrounding centres saw prices ease from last year. Airdrie's detached benchmark of $587,300 is now about 20 per cent below Calgary's, as resale homes there compete with new construction and supply in nearby centres. Cochrane and Chestermere are both close to six months of supply, while Okotoks and High River remain tighter.
What this means for you
If you're buying: you have more choice and more room to negotiate than a year ago, especially for condos and townhomes. Take the time to compare, and don't assume list price is the starting point everywhere.
If you're selling: the citywide number is less useful than ever. A detached home in the West or City Centre is in a very different position from a condo in the North East. Pricing to your specific segment and district is what gets homes sold in this market.
If you're moving up from a condo or townhome: your sale price may be softer than it would have been a year ago, but detached buyers also face less competition, with months of supply up from 2.89 to 3.34. Planning both sides of the move together is where the numbers start to make sense.
If you'd like to see what October's numbers mean for your home or your search, I'm happy to walk through it with you. Reach out anytime at 587-907-5258 or [email protected].
Source: CREB® (Calgary Real Estate Board), City of Calgary and Calgary Region Monthly Statistics, October 2026.
FAQ
What is the average home price in Calgary in October 2026? Calgary's total residential benchmark price was $564,200 in October 2026, according to CREB. The median sale price was $562,500 and the average sale price was $640,769.
Is Calgary a buyer's or seller's market right now? It depends on the property type. With just over three months of supply, detached and semi-detached homes remain relatively balanced. Apartment condos (5.28 months) and row homes (4.44 months) have more supply, which CREB notes tends to favour buyers.
Are Calgary home prices dropping? Overall prices are close to flat, with the total benchmark down 0.4 per cent from October 2025. Apartment prices are down 7.9 per cent and row prices are down 5.1 per cent, while semi-detached prices rose 0.8 per cent.
Which Calgary districts saw price gains in October 2026? The West (up 2.5 per cent), City Centre (up 1.8 per cent) and South (up 0.1 per cent) districts posted year-over-year gains in their total benchmark price. The North East and East saw the largest declines, at 5.7 and 6.2 per cent.
How do Airdrie, Cochrane and Okotoks compare with Calgary? In October 2026, benchmark prices were $502,500 in Airdrie, $571,100 in Cochrane and $600,100 in Okotoks, compared with $564,200 in Calgary. All three were lower than a year earlier, and Cochrane had the most supply at 5.82 months.